


This article is co-authored by Andy Carvell, Kevin Bravo and Tessa Miskell, based on a data investigation project conducted by Phiture in partnership with CleverTap.
Introduction
‘Mobile Engagement’ is a nebulous term; it gets bandied around in many situations, often with scant regard for its definition.
In the broadest of terms, Engagement can be considered the act of the user interacting with / using the product. It’s often brought up along with Retention, so perhaps it’s also useful to differentiate these two terms:
Retention measures whether a user returns to the app in a given time period
Engagement measures what users do when they are in the app
In this article, we propose a framework (the ‘Acknowledgment-Interest-Conversion Framework, or AIC for short) for measuring and analyzing engagement that might prove helpful when monitoring the usage of an app and inform growth initiatives designed to increase meaningful engagement.
All Activity is not Equal
Consider two users: User A opens Instagram on Monday, browses her feed, likes two posts, replies to a comment, then posts a photo with some accompanying hashtags. User B opens Instagram, skims their feed, and closes it again after a few seconds.
It’s clear that User A demonstrated significantly higher engagement on Monday. However, both users are considered retained and — by many traditional measures — active and engaged.
Both users would be considered part of the Daily Active Users (DAU) metric on this day. They would also qualify both users as Monthly Active Users (MAU) within a 30-day window of the day in question and Weekly Active within a 7-day window.
Some companies opt to combine engagement and retention into key metrics such as Monthly Active Listeners (SoundCloud) or Weekly Active Pinners (Pinterest) and may even decide to make such a measure their North Star Metric.
While many metrics (e.g. DAU, MAU) simplify engagement to binary terms (counting a user as either active / engaged, or not, in a given period), it’s important to understand that engagement is a continuum, ranging from low-value to high-value actions. A user may traverse this spectrum rapidly within the space of a few sessions, or remain stubbornly stuck in a low-engaged state for days, months, or years, without necessarily abandoning the app.
Understanding Engagement
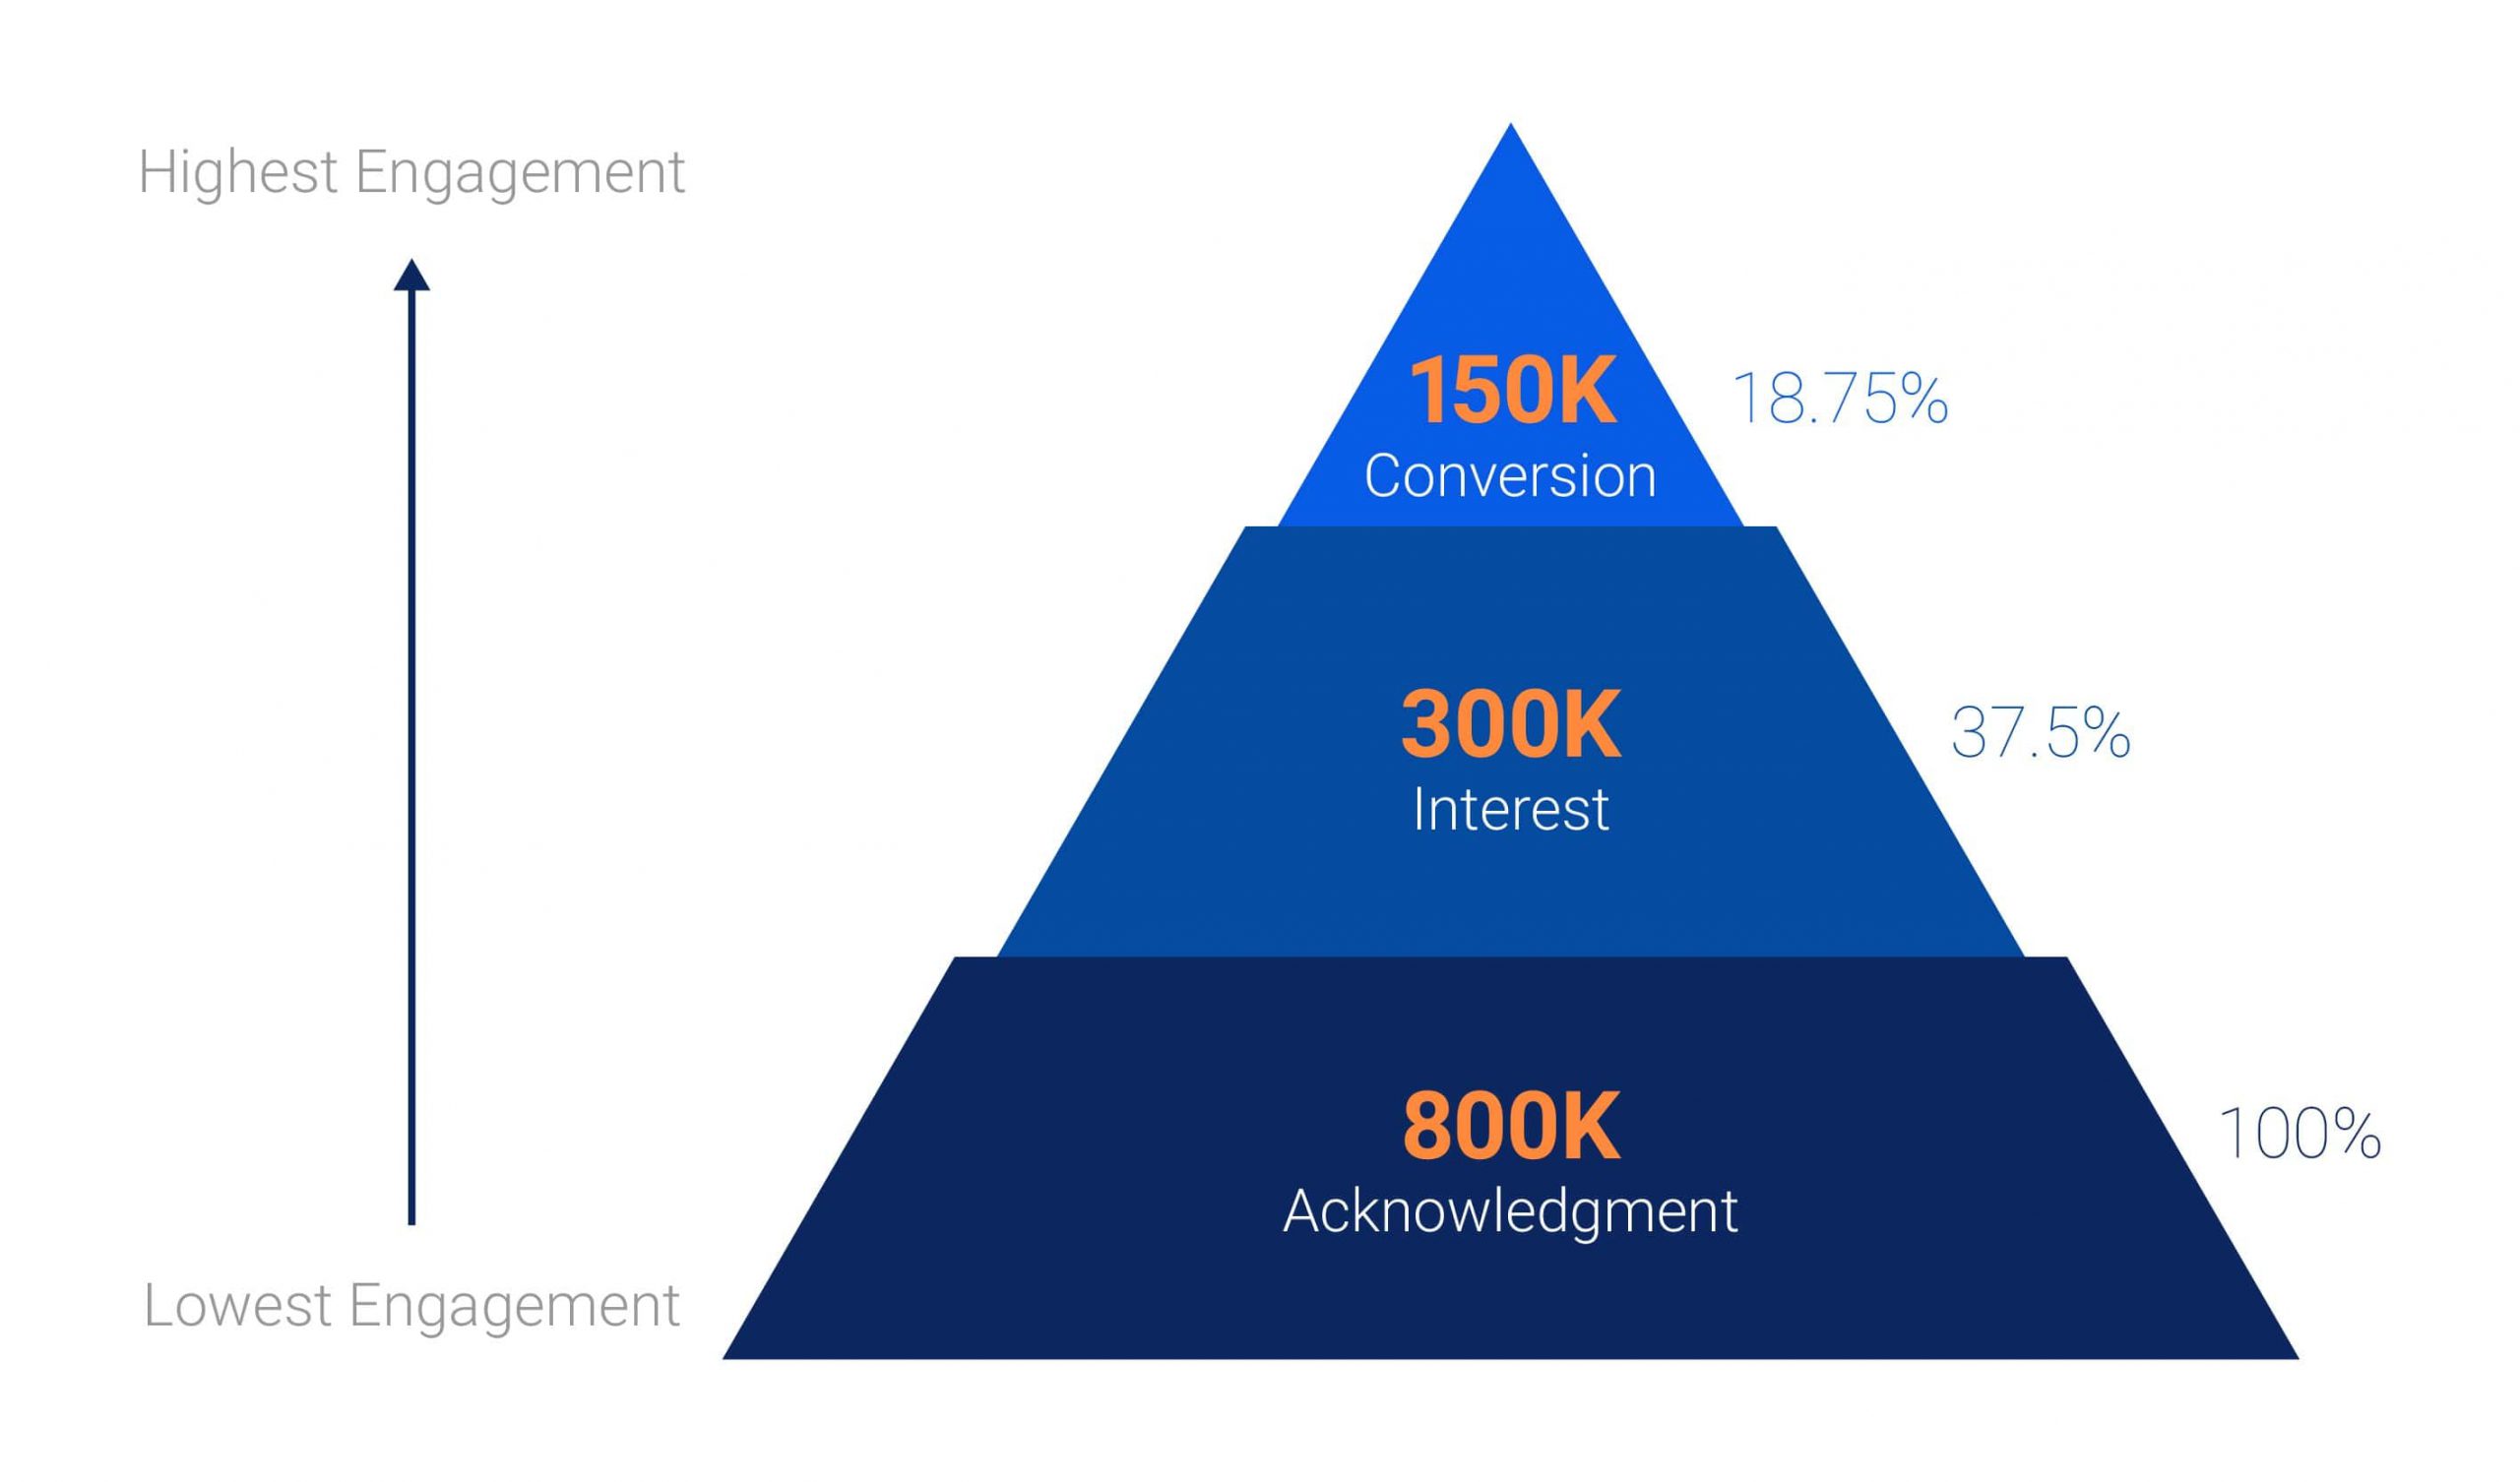
Engagement can be considered in the form of a hierarchical pyramid, with different actions falling into different layers:
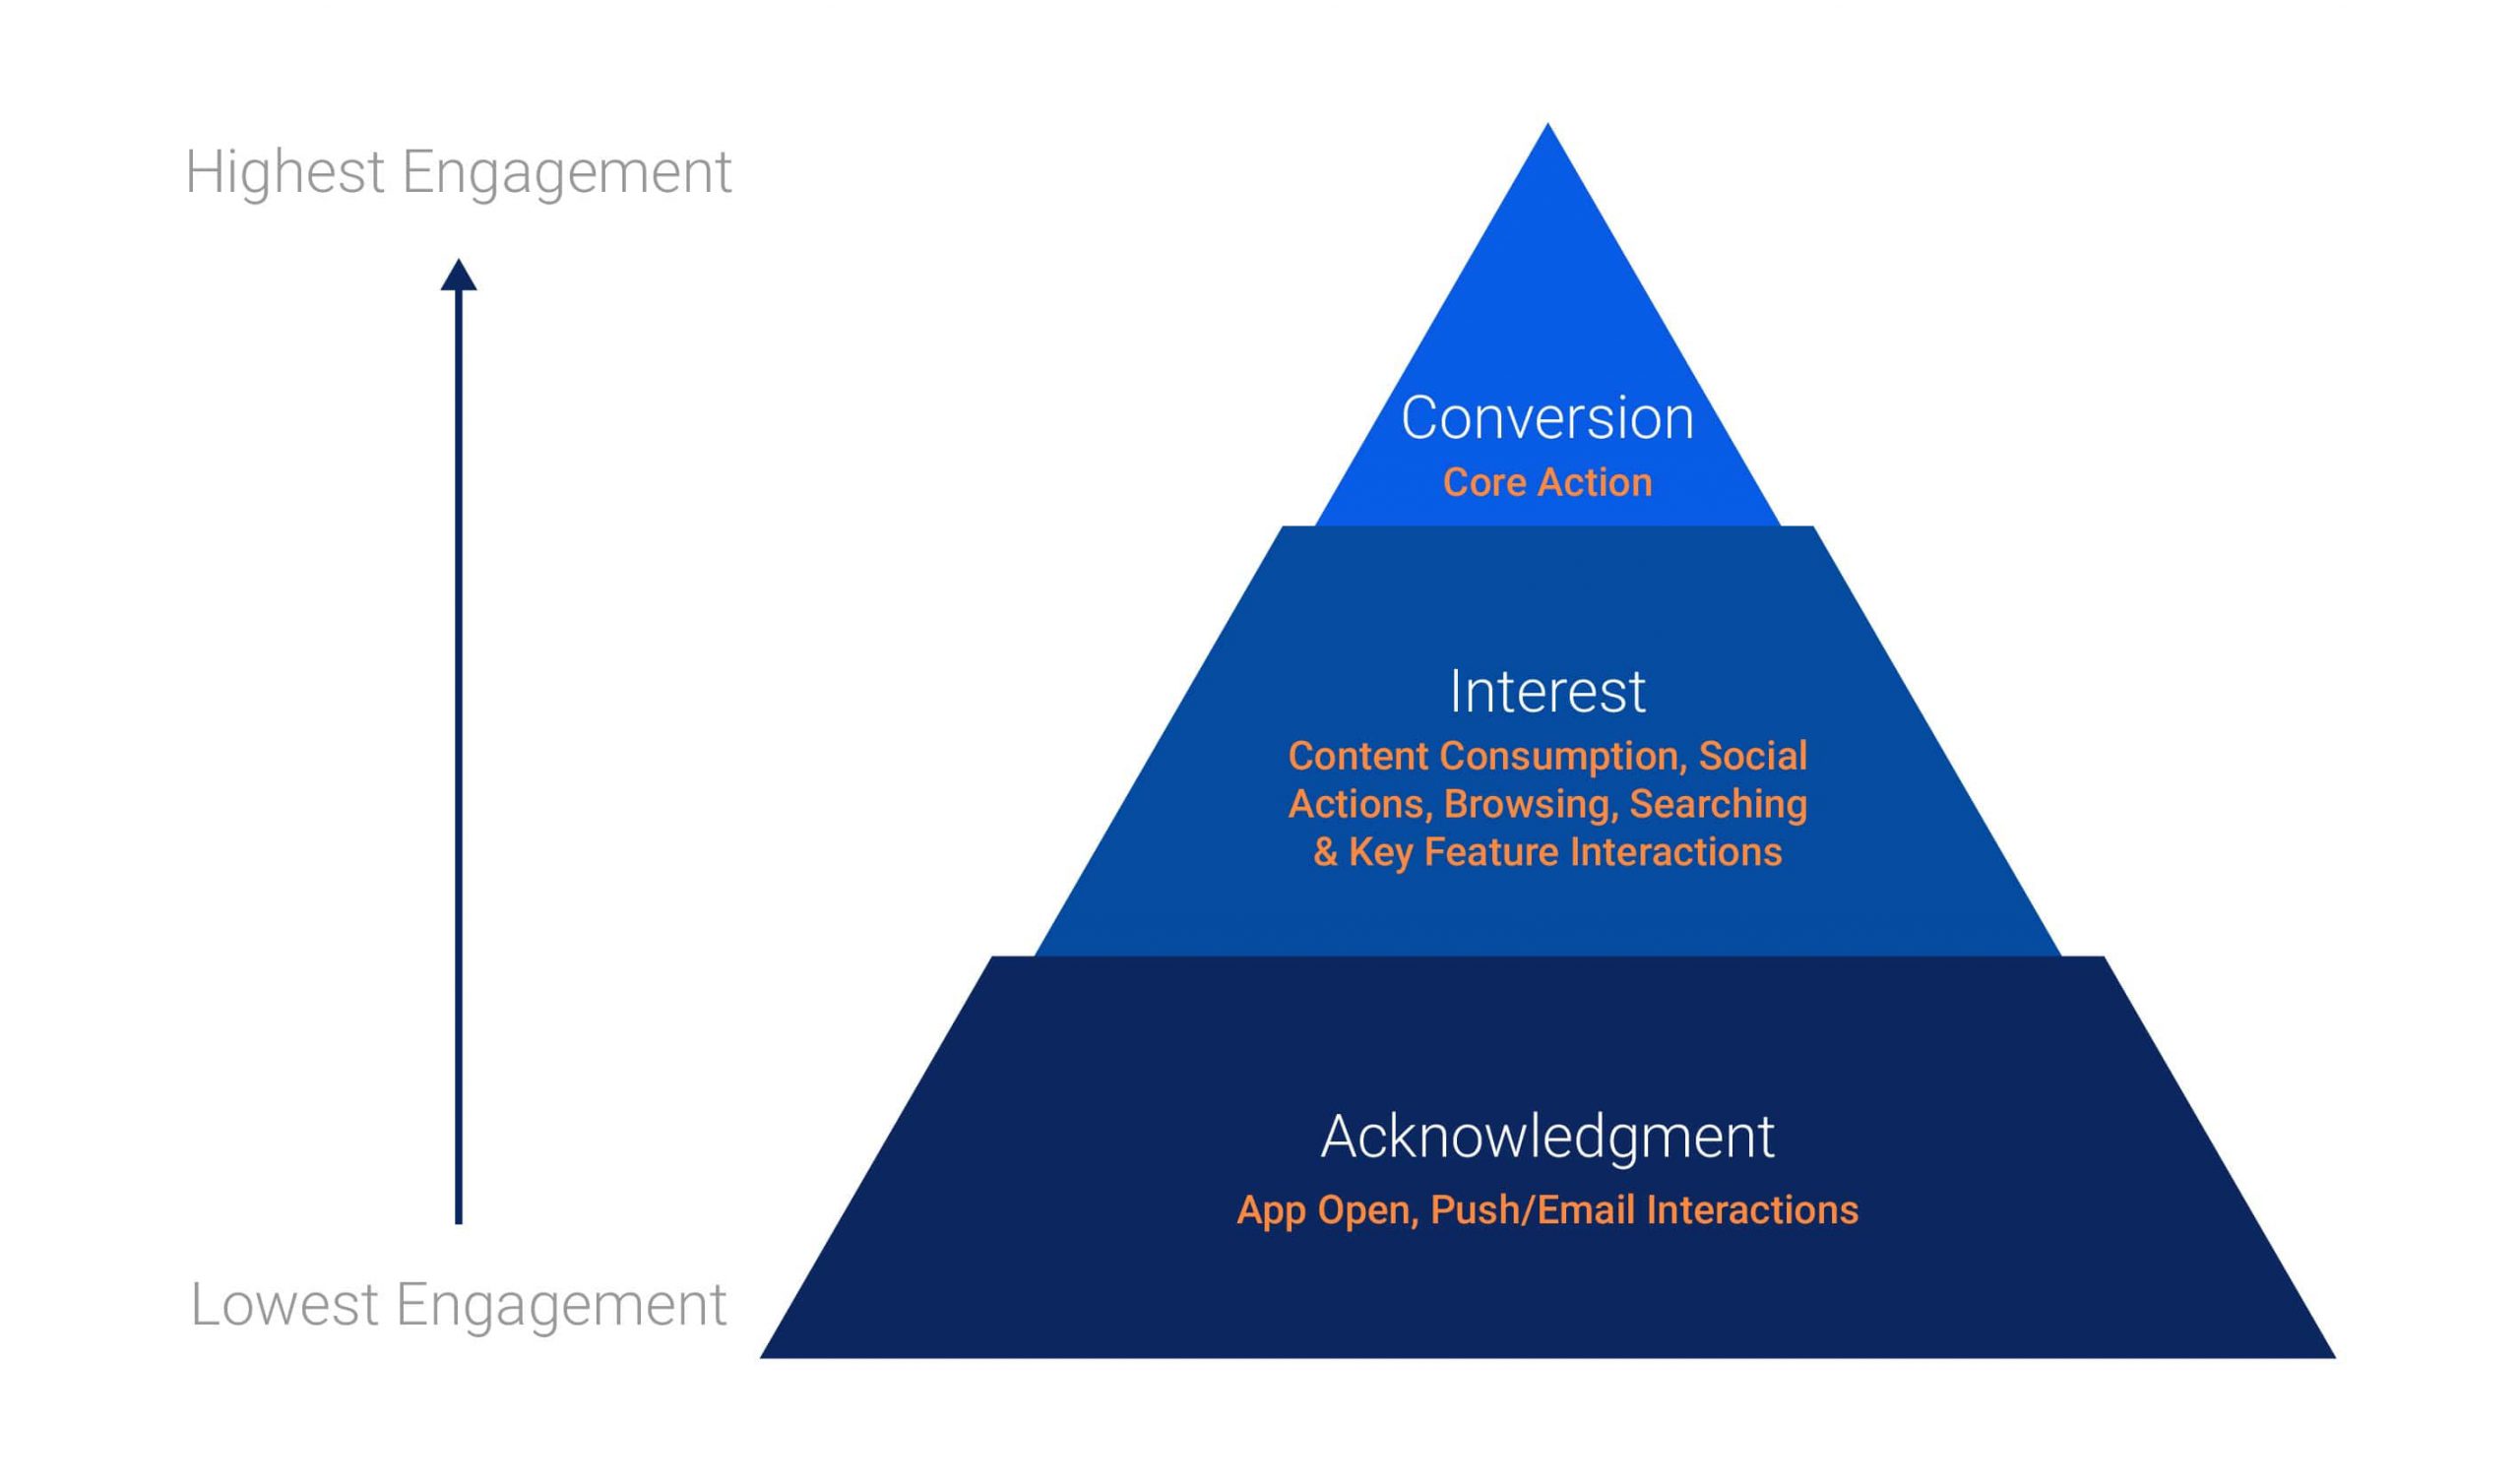
AIC Framework: a more nuanced view of engagement
The pyramid, as we’ve defined it, consists of 3 layers of increasing engagement value, with a ‘core action’ at the top, representing the highest-value action a user can take within the app (in e-commerce, this would be a purchase, for social apps, it’s likely to be creating a post, for a todo-list app, it would be creating to-dos).
By classifying key user actions into one of these three layers, we can use the AIC framework to analyze user behavior at aggregate, cohort, or individual user level in the context of the value this engagement contributes to the business.
The Acknowledgement Layer
This is the lowest level of user engagement. Actions the user might take that would be classified as ‘acknowledgment’ actions include opening the app and interacting with push notifications or email messages received outside of the app. These actions in themselves don’t represent a strong intent. This would include users who were effectively retargeted through advertising and deep-linked back into the app.
Events this layer contains:
User opens the app
User opens a Push Notification / Email
The Interest Layer
This classification would cover the majority of user actions within most apps. Any action the user can take that demonstrates real intent/interest in key app content, features, or other users (in the case of social platforms) would be classified as an Interest Action.
Events this layer contains:
Deliberate, user-initiated, high-intent actions such as: tapping on feed items/products/content to ‘consume’ these items, initiating search queries, use of key features within the app.
Events this layer does not contain:
Automatically-generated events (not requiring user input), Scrolling, Switching between tabs, Changing settings or other ‘admin activities’, and anything except deliberate access to content or interaction with key features.
The Conversion Layer
In the majority of cases, it should be possible to designate one specific user action as being a core action, both to the user experience and also to the business of the app publisher. This Conversion event need not be a monetization event such as a purchase, but it should be closely aligned to the ultimate success of the product.
The Conversion event delivers value to the user and hence makes good on the value proposition of the app. In some apps, this core action will be taken very regularly by a significant portion of users (e.g. posting on Instagram), whereas in others (e.g. travel booking) it may happen more rarely, among a smaller but highly-valuable subset of the user base.
Events this layer contains:
Only the Conversion event: Purchase, Create a Post, Do a training session (fitness app example), Book an Appointment, Request a Viewing, etc.
Events this layer does not contain:
Any other events
Implementing the framework: creating your own AIC Snapshot
Any framework is only useful if it aids conceptualization. Any framework involving KPIs or metrics should also ideally satisfy some additional criteria:
- The framework delivers value over established approaches
- The approach is easy to explain within the company and to implement
In the case of AIC, there is some inherent tension between these two aims: our research and analysis to date show that it can provide valuable, actionable insight, albeit with greater complexity than some traditional metrics.
For more on different levels of engagement and the concept of a Core Action (the action we track in the Conversion layer), we strongly recommend checking out Sarah Tavel’s Hierarchy of Engagement framework, this post from the ever-awesome Reforge blog and these lessons learned at Pinterest from Casey Winters.
The AIC model is our attempt to create a standardized approach to stratifying and analyzing the engagement of active users in a mobile app context. We leave it for the reader to decide whether the framework is interesting enough to invest the additional effort to track and analyze versus metrics such as DAU, MAU and single event counts.
Setting up tracking to monitor the layers
In order to track engagement and use the framework, it’s first necessary to consider the key actions a user can take within the app and to classify them as either Conversion, Interest, and Acknowledgment.
Each of these actions should have a corresponding Event being tracked in analytics. In a typical analytics tracking setup, there will be a lot of events tracked, including many things that can be excluded from AIC analysis; it’s simpler to set up if you only consider the key intent-driven actions that the user can perform.
Since a user only has to trigger one of the Layer’s events to be counted in that layer of the pyramid, any additional events triggered will not affect the result; this is roughly analogous to the concept of being counted as ‘active’ in a given period (e.g. monthly) regardless of the frequency of use within that time period.
Let’s take the example of Fishbrain, a social fishing app. Fishbrain users can ‘log’ catches, posting a photo and other accompanying information about the fish they caught. Logging catches is considered to be the Conversion event, since much of the other engagement on the platform stems from social interactions (likes, comments, etc.) with a social feed, which mostly consists of logged catches.
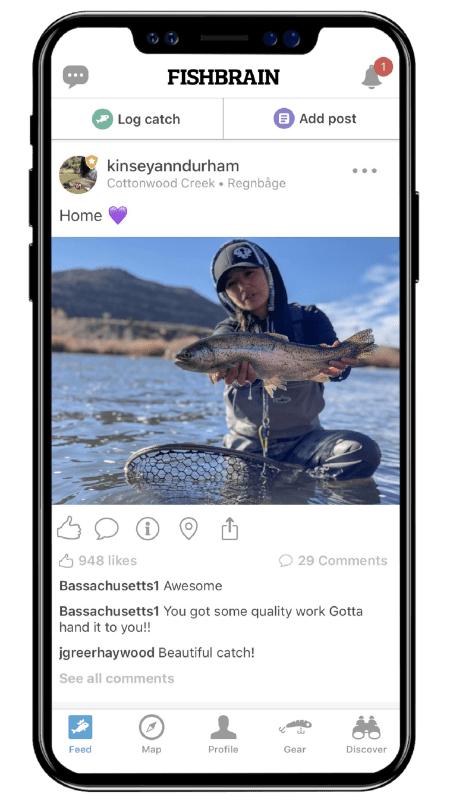 So, for Fishbrain, we can define the layers of our AIC model as follows:
Conversion
Log Catch event / Create Post events
Interest
Like, Comment, Share, Search, clicking on items in the feed, or in the Gear and Discover tabs.
Acknowledgment
Opened the app, Opened Push / Email
Note that, in this framework, interactions with lifecycle messages and activity notifications are classified in the lowest level of engagement: Acknowledgment.
This keeps us honest; if these messaging campaigns are not leading to a decent amount of genuine (Interest or Conversion) engagement, the messaging is probably not relevant enough and could even be counterproductive. As such, we count interaction with a message as very low-intent engagement, but it still counts for something.
Discard all other tracked events from the analysis
All other events (of which there may be many: server-side events, screen events, interactions with menus or other low-level engagement) can be omitted from the analysis since they don’t represent significant, intent-based engagement.
We recommend being highly selective with the events classified as Interest. A good rule is to only track things where the user is actively clicking on items, adding things to a shopping basket, actively consuming content and similar deliberate actions that represent genuine intent.
If a user doesn’t need consciously decide to do a specific action for it to be tracked as an event, this event should not be included in the Interest layer
The table below details some examples from popular app categories, to give an idea of what kind of events would be in the Interest and Conversion layers for these apps (the Acknowledgement layer is the same for all apps).
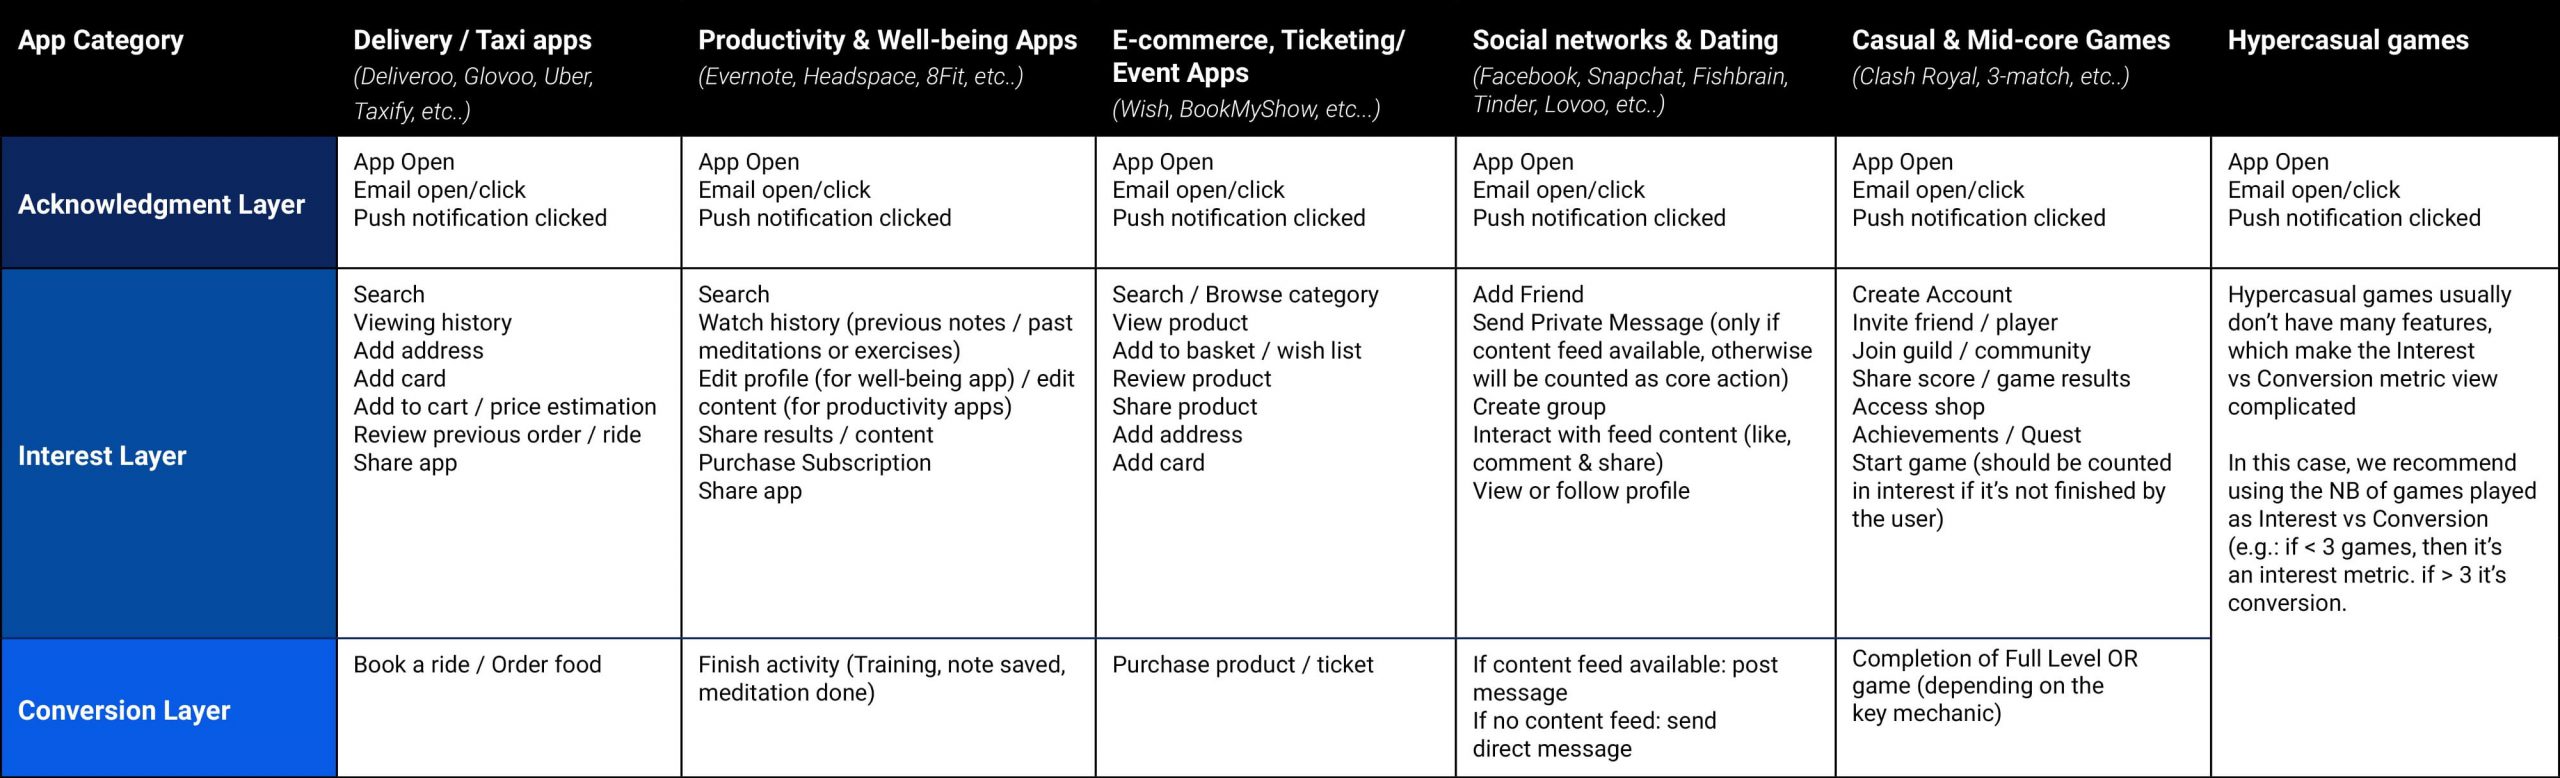
Examples of events for each Layer for some common app categories (available here as a spreadsheet guide)
Creating an AIC Snapshot
Once the events that will contribute to each of the layers have been decided, it’s possible to generate a snapshot of engagement for use with internal dashboards, or for trend analysis.
Each layer of the pyramid is calculated according to the number of users who trigger an action associated with this layer. i.e. if precisely 100 users opened the app in the past month, the Acknowledgement layer would have a size of 100.
Layers are not mutually exclusive; the opposite is true. In order to trigger a Conversion event, a user will certainly open the app (Acknowledgment) and — in the vast majority of apps — register some Interest first by clicking on some content or otherwise displaying Interest-level engagement. It’s not strictly a funnel, but it’s normal for all users counted in the Conversion layer to be also counted in Acknowledgment and Interest.
The AIC Snapshot for a given period e.g. the past month would, therefore, look something like this:
An example monthly AIC Snapshot
Having such a snapshot visible on team dashboards, refreshing daily, would provide an at-a-glance measure of the activity and the relative health of the app. It might also help to catch some issues early i.e. if a bug is preventing some users from doing the core action (Conversion event), it will be immediately obvious from an AIC Snapshot that something is wrong, whereas DAU numbers would remain relatively healthy initially.
DAU should correspond very closely to the number of users we see in the Acknowledgment layer in a daily snapshot. If they open the app, they’re counted in this layer, so the framework essentially incorporates DAU, as well as two increasing levels of higher-intent activity in the Interest and Conversion layers.
The AIC Model is most useful as a Dashboard Metric, providing a snapshot of engagement and active user composition. To dig deeper into trends teams could use Investigative Analytics techniques
Generating deeper insight using the AIC Framework
Once the key events have been categorized and the metrics for Acknowledgement, Interest and Conversion can be calculated for any given period from historical event data, some further analysis can be applied:
Trends over time
Observing how the layers grow or shrink over time gives an indication of how well the app is performing: ideally, the absolute numbers show an upward trend (user growth) and the percentage of users in the Interest and Conversion layers also increases over time. These trends should also be observed in other company metrics, but one could get a good sense of overall health from the AIC trends alone in a dashboard view and then dig deeper using Investigative Analytics to identify which precise events are contributing to the growth or decline of numbers in each layer and to perform segmentation or funnel analysis to identify the root cause of the change.
Note that changes won’t always come from User Acquisition, growth team or product team initiatives: external factors such as seasonality and market competition can also be powerful influences on your AIC Snapshot trends.
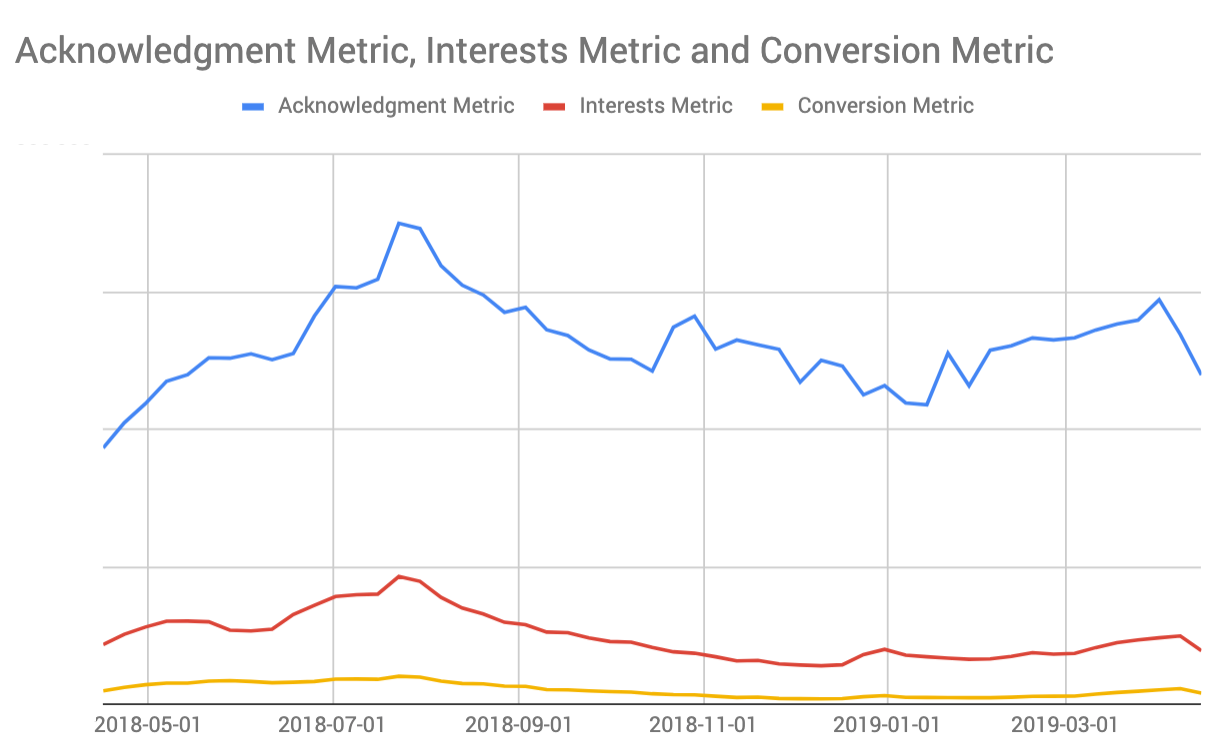
Trends over time show seasonality, content/inventory-driven effects, user acquisition spikes, and more
Ratios between layers
It’s useful to understand the ratio of unique users in Conversion, Interest and Acknowledgment respectively. These ratios typically show less volatility than the absolute numbers and vary quite a bit for different types of apps; social apps and content-based apps typically have quite a large Interest and smaller Conversion layers (so ratio can look something like 3:2:1 from Acknowledgement:Interest:Conversion), whereas some simpler and more transactional apps typically tend to skew more towards core (for example a 3:1:2 type ratio).
Just as you can observe overall numbers and %ge of the total unique users in each layer (as described above), you might also want to track how the ratio changes over time. If you see that scaling user acquisition or CRM campaigns just fattens the Acknowledgment Layer (i.e. the ratio increases at the bottom of the pyramid), this can be an indicator that these efforts are ultimately ineffective.
Elasticity
Those readers who studied economics will be familiar with the concept of price elasticity of demand (sometimes known as price sensitivity), whereby the effect of price changes on the demand for specific goods or services is explored. The concept of elasticity/sensitivity can be explored in relation to other combinations of independent and dependent variables and at Phiture we have found this analysis technique useful when the AIC Model is applied.
Understanding how much Interest or Conversion is likely to grow if you are able to grow Acknowledgment (i.e. through increased User Acquisition, or sending a higher volume of push notifications or Emails, for example) can inform growth strategies; more on this later.
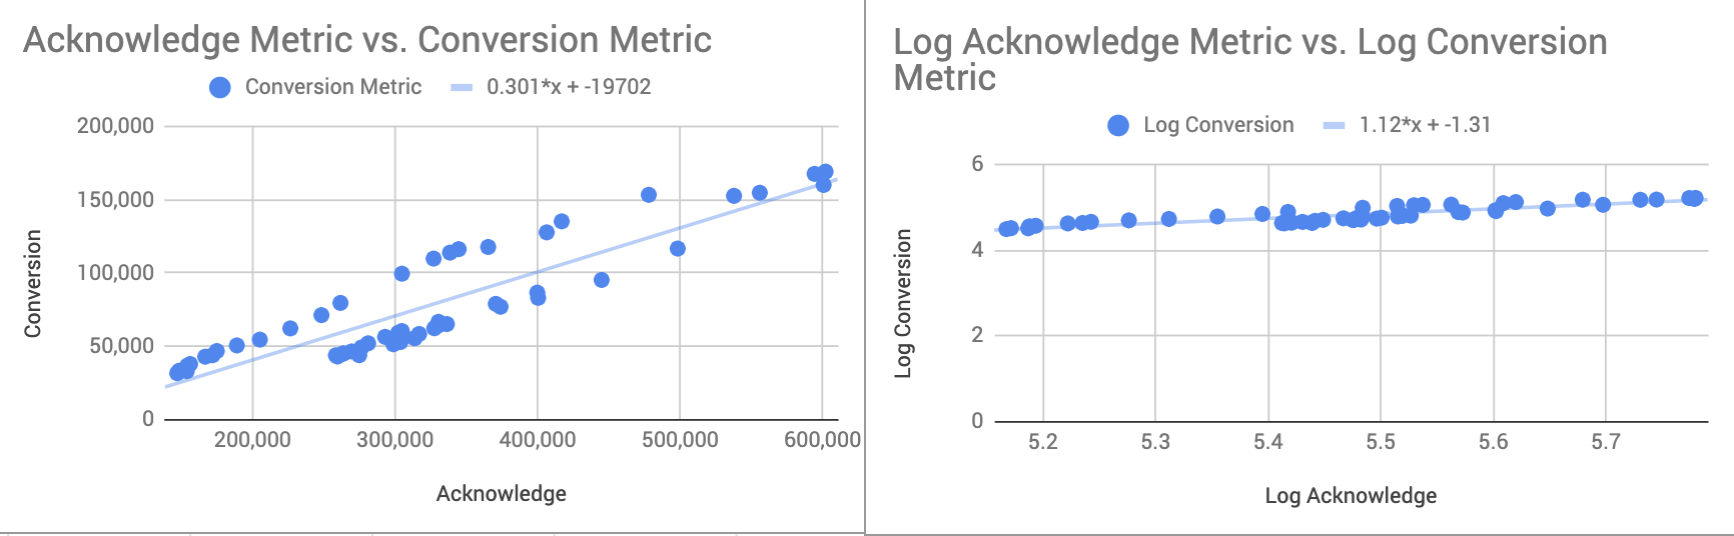
Exploring Correlation and Elasticity between Acknowledge Metric and Conversion Metric
In the above example, we see a pretty strong correlation between Acknowledge and Conversion and the model indicates that an increase in the size of the Acknowledgement layer of 1% could deliver a 1.12% increase in Core (assuming the model holds; it’s just a prediction, based on historical data).
Applying a Funnel Perspective
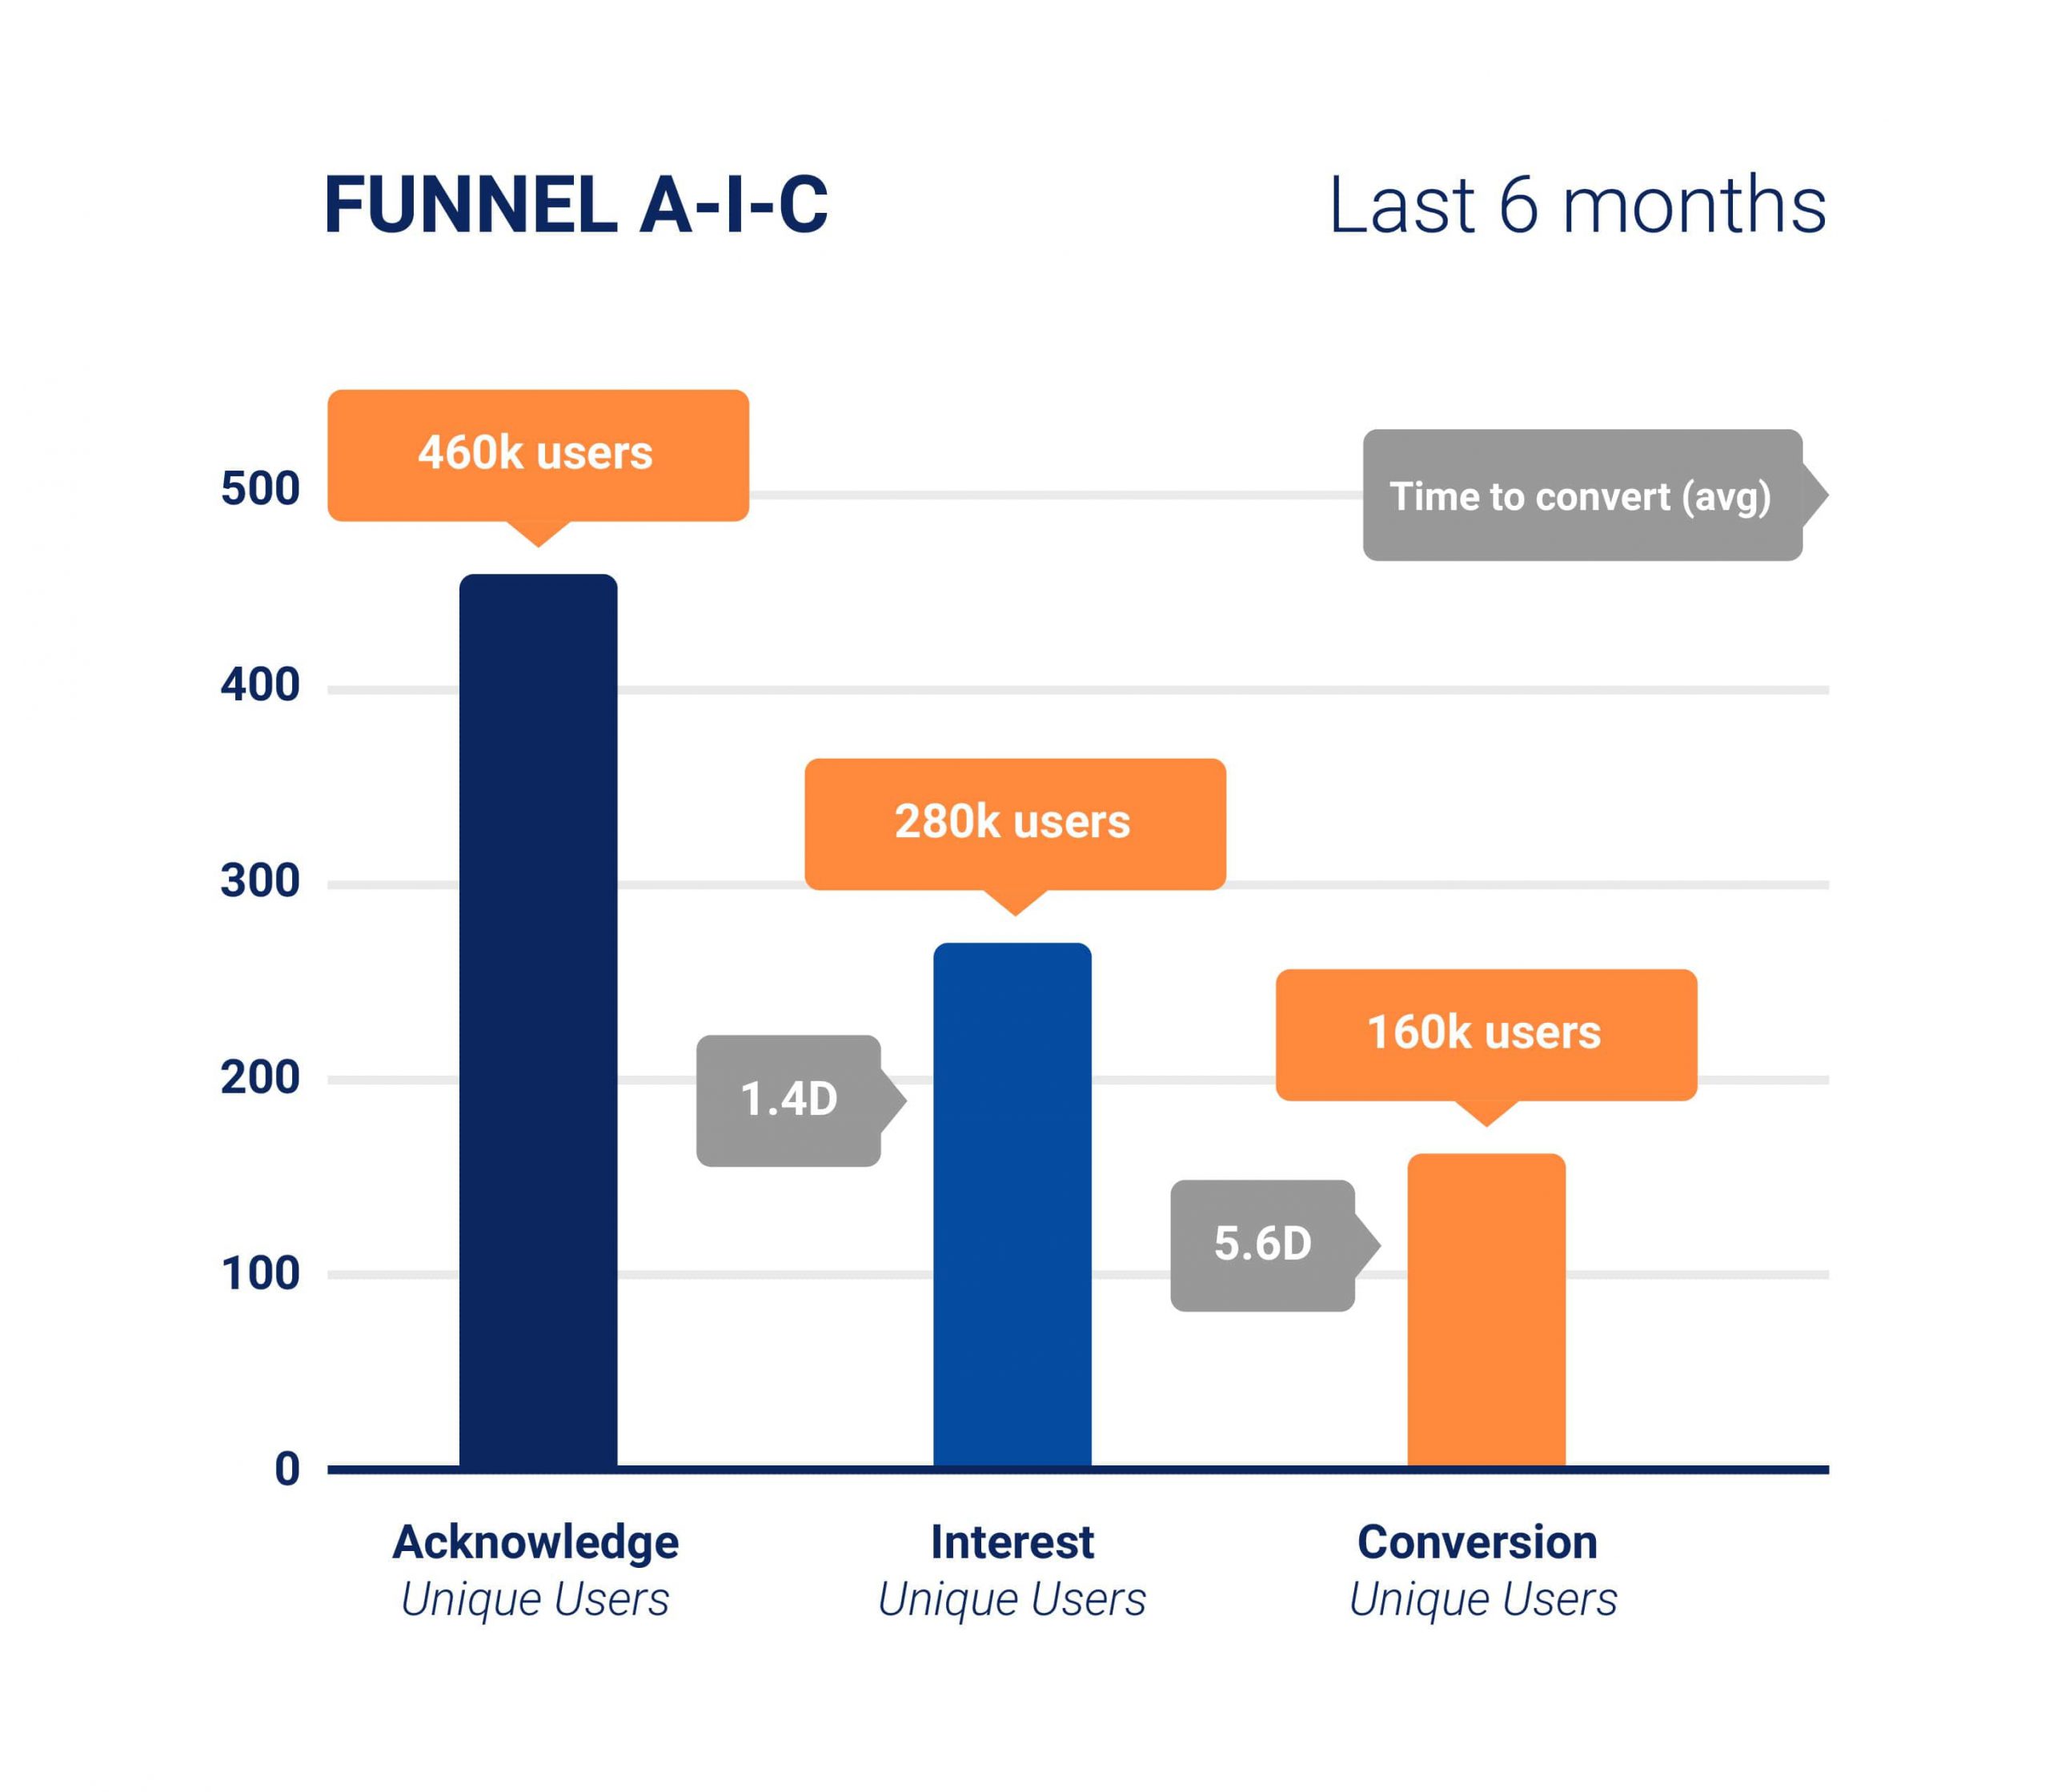
Applying a funnel view to see how long users (either individually, by segment, or on aggregate) are taking to move between layers can provide additional insight into how long it takes users to progress between the layers of engagement.
Note: a classic funnel view expects that users will progress in a strict order between funnel stages, so if you set up a funnel that requires users to complete any Acknowledgement action, followed by any Interest action, followed by any Conversion action, your results will exclude users who jump straight from Acknowledgment to Conversion, which may be possible — or even common—in some apps.
Turning Insight into Action
As with any metrics, these numbers in dashboards, trend charts or elasticity analyses are only useful if they provide some meaningful insight that informs the next actions.
Since the AIC Framework is designed to provide a high-level snapshot of overall engagement health, its metrics (Unique Users in Acknowledgement, Interest, and Conversion for a given time period) are Outputs, rather than Inputs. This is the case for pretty much all Dashboard-Level metrics.
Teams shouldn’t aim to influence Output metrics directly, working instead on input levers and sub-metrics that have been identified by growth and product teams. For a great explanation of Input vs Output metrics and how to identify growth levers, check out Brian Balfour’s article on this topic over at the Reforge Blog.
This doesn’t mean that Dashboard KPIs do not provide actionable information: quite the opposite. They give an early signal of problems and opportunities (especially when combined with trend data) and provide a signal that can and should be explored at a deeper level using investigative analytics (running queries and building charts to understand what exactly is changing and why).
At Phiture, we have found that applying the AIC Framework to apps across various categories provides a deeper level of visibility in a company-level dashboard view than the typical MAU or DAU metrics. Changes in layer ratios can raise important questions that would not otherwise be asked and triggers investigations, deep-dives, hypothesis generation, and experimentation.
Let’s get into specifics: below are some examples of hypotheses that might arise from applying AIC and the next steps a team might take to explore them.
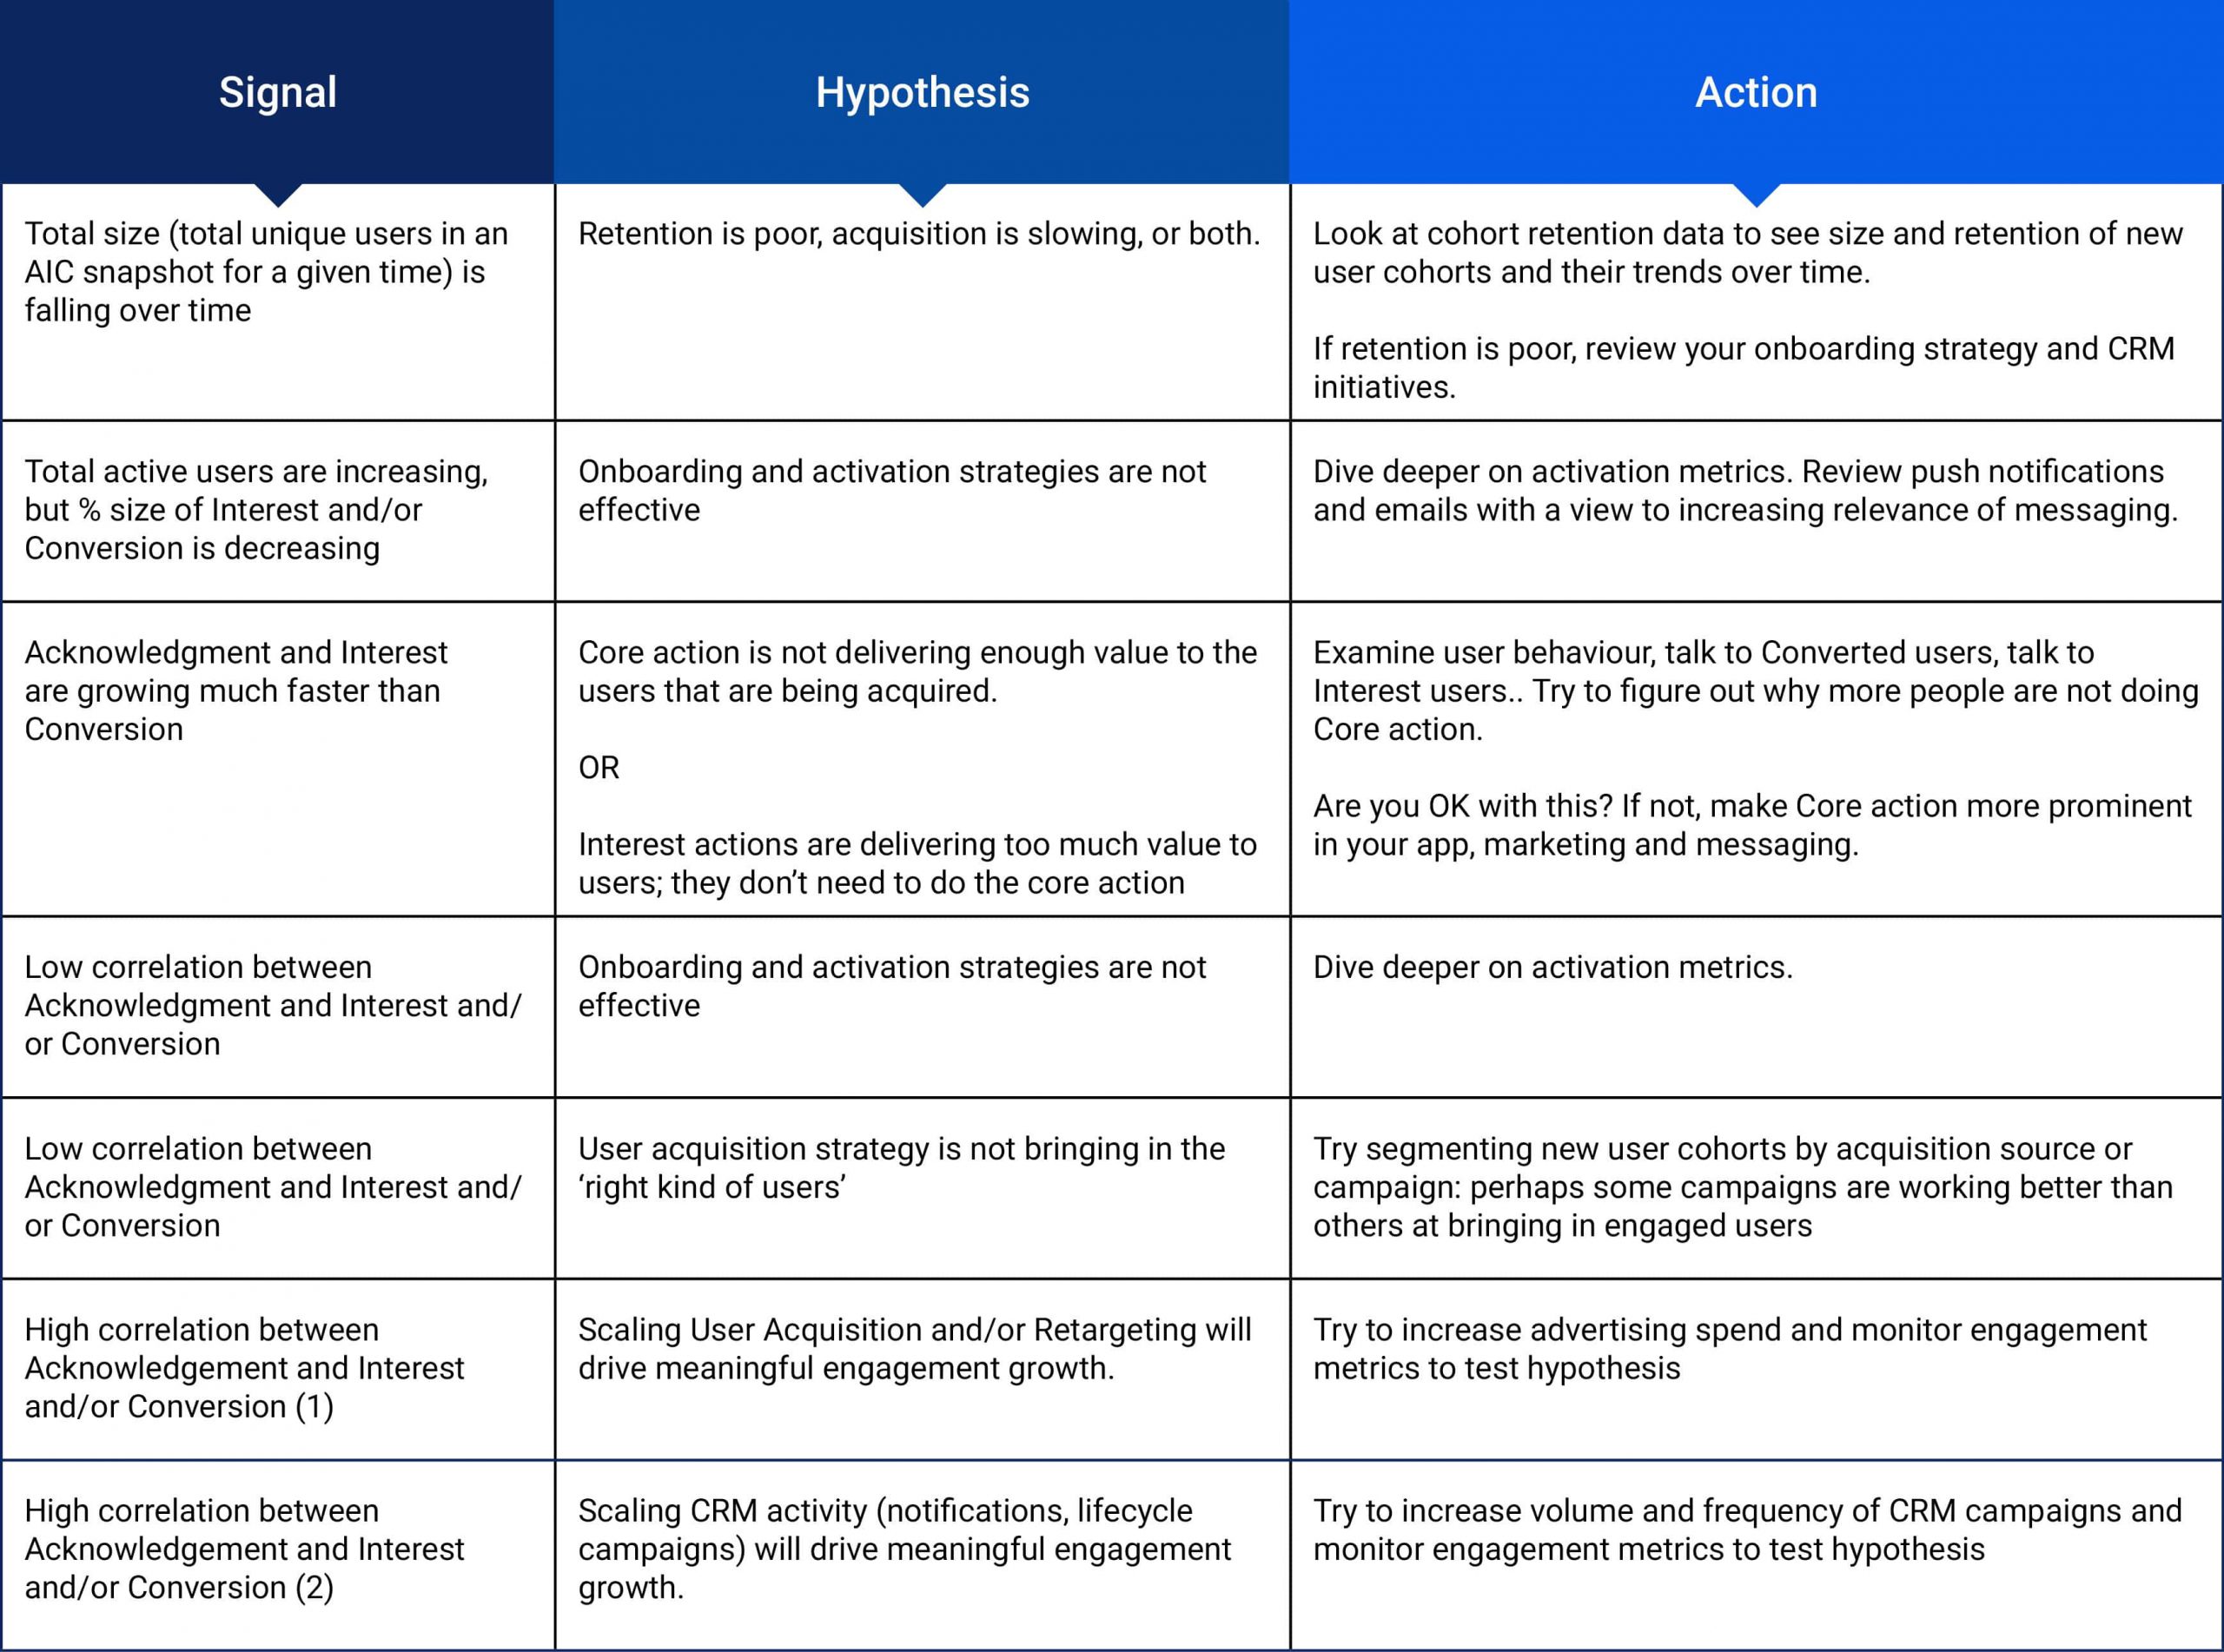
Turning Insight into Action using the AIC Framework
Summary
- AIC is a framework that breaks down active users in a given period by the level of engagement they have displayed in that period
- AIC is not as simple to apply as basic MAU or DAU active user metrics, but stratifying engagement into layers provides deeper insight into user activity and de-emphasizes basic app-opens as a signal of app health.
- Applying the framework to a specific app forces the team to think about which events constitute Conversion actions and which ones demonstrate a genuine level of Interest.
- Including notifications + emails as part of the Acknowledgment, layer keeps us honest about whether they really work: A good indicator that a CRM program is effective is when a higher correlation and elasticity between Acknowledgement and Interest Metrics is observed when filtering for opted-in users than those not receiving emails and pushes.
- Observing the relative changes in Acknowledgment — Interest — Conversion over time provides a useful indicator of the health of the app. Changes will show the effectiveness of product and marketing activities, combined with external factors including seasonality.
In subsequent articles, we’ll go into detail with worked examples of AIC in action and how the analyses we’ve described have led to actionable insight in real-world examples.
Table of Contents